What Does a DFIR Report Contain? Inside a Simply Data Digital Forensics Investigation
What Is a DFIR Report?
A DFIR report is the final deliverable from a Digital Forensics and Incident Response engagement. Unlike a standard IT incident report, a DFIR report is structured as forensic evidence — meaning every finding is tied to a specific artefact, every conclusion is supported by documented evidence, and every gap in the evidence is explicitly stated.
Malaysian organisations increasingly need DFIR reports for three reasons: regulatory compliance (BNM RMiT, PDPA breach notification), insurance claims following a cyber incident, and legal proceedings where evidence integrity must be established.
The Simply Data DFIR Report — Section by Section
1. Document Control
Every Simply Data DFIR report opens with a version control table: issue date, version number, preparer, and remarks. In a real incident, reports go through multiple versions — the first draft is produced quickly for the client’s immediate response, and later versions incorporate additional evidence or analysis. Version v1.1 means a review and approval pass was completed; a note in the document control section explains what changed.
2. Executive Summary
The executive summary is written for the CISO, CEO, board, and legal counsel — people who need the full picture without reading 30 pages of technical analysis. It contains five components:
2.1 Incident at a Glance — a structured table showing: detection date and time (in MYT — Malaysian time), who reported it, the affected asset, the attributed account, the subject host examined, the host’s role in the environment, and the exact scope of the engagement. This table makes it immediately clear what was investigated and what was out of scope.
2.2 Investigation Conclusion — the analyst’s formal finding on the primary question. In a ransomware case, this might state whether the entry vector was established, what evidence supports or contradicts each hypothesis, and what confidence level applies to each conclusion.
2.3 Pre-detection Conditions — standing vulnerabilities and misconfigurations that were present before the incident and that are material to understanding what happened. These are reported even when they are not the direct cause of the incident, because they represent real risk that must be remediated. Examples from real investigations include: plaintext credentials stored in world-readable files, RDP exposed to the Internet via misconfigured firewall rules, event log retention so short that pre-incident logon evidence is irrecoverable.
2.4 Post-detection Observation — activity observed after the incident detection timestamp. Post-incident activity (such as opportunistic RDP brute-force campaigns from external actors) is documented but explicitly labelled as post-incident so it cannot be misread as evidence of the original entry vector.
2.5 Evidence Examined — a full table of every data source analysed: Windows event logs (Security, System, Application, PowerShell-Operational), application logs, Azure VM agent logs, configuration files, host state snapshots (firewall rules, registry hives, Defender configuration), file system metadata, live-host triage collections, and physical memory images.
3. Forensic Methodology
Simply Data DFIR reports follow the NIST SP 800-86 (Guide to Integrating Forensic Techniques into Incident Response) four-phase model, augmented with the Identification and Preservation phases from the SANS DFIR curriculum. Adversary tradecraft is cross-walked to MITRE ATT&CK v15.
The six methodology phases:
| Phase | What Simply Data Does |
|—|—|
| Identification | Inventory all artefacts in scope. Record any scope discrepancies as evidence gaps. |
| Preservation | SHA-256 hash every evidence item before analysis. No writes, executions, moves, or deletions of suspect binaries or log channels. |
| Collection | Read-in-place collection of event logs, registry, application logs, and network state. Supplementary live-host triage using KAPE (KapeTriage target) and Velociraptor to capture AmCache, BAM, SRUM, Shellbags, LNK files, RecycleBin metadata, Edge History, and a full physical memory image. |
| Examination | Per-artefact cataloguing: source identified, exact query documented (PowerShell, XPath, or wevtutil), result quoted verbatim with sensitive data redacted. |
| Analysis | Three-hypothesis evaluation framework with explicit confidence level per hypothesis, supporting evidence, and refuting evidence. MITRE ATT&CK v15 cross-walk for all behavioural indicators. |
| Reporting | This document, structured to the Simply Data DFIR report template, with findings labelled by domain (F-PROF for system profile, F-AUTH for authentication, F-NET for network, F-PERS for persistence, F-FS for file system, F-APP for application). |
The report also includes a confidence calibration table so readers know exactly how to interpret analyst certainty:
- High — directly observed on-host with documented chain of custody
- Medium — inferred from multiple corroborating artefacts
- Low-Medium — inferred from a single artefact or by elimination
- Low — single source or insufficient corroboration
This calibration makes the DFIR report legally defensible and distinguishes the Simply Data approach from reports that state conclusions without grading their evidence.
4. Incident Overview
A narrative description of what happened: who reported the incident, when, what asset was affected, what role that asset plays in the organisation’s environment, and what Simply Data was engaged to investigate. This section establishes the factual record and is often cited directly in insurance claims and regulatory notifications.
5. Root Cause Analysis
The formal root cause finding. Critically, Simply Data reports state when a root cause cannot be established — and explain exactly why, naming the specific missing data source (an “evidence gap”) that would be needed to prove or disprove each candidate hypothesis. This intellectual honesty protects the client from acting on incorrect conclusions.
6. Hypothesis Ranking
This is a distinctive feature of the Simply Data DFIR methodology. Rather than presenting a single narrative, the report ranks every candidate explanation for the incident by confidence level. Each hypothesis is assigned an ID (H-1, H-2, H-3), a description of the attack path it proposes, and a confidence rating. Where a hypothesis cannot be promoted above Low-Medium without external telemetry, this is stated explicitly and the required evidence is named.
7. Attack Timeline Summary
A chronological table partitioned around the detection timestamp. Every event is labelled as either pre-incident (admissible as causal evidence), detection moment (the anchor), or post-incident (situational only, cannot prove the original entry vector). This partition prevents post-incident activity from being incorrectly attributed to the original attack chain.
8. Indicators of Compromise (IOCs)
IOCs are grouped into three categories:
- Host-resident indicators — specific files, binaries, configuration states, and access-control conditions present on the host. Each is documented with full file path, SHA-256 hash, last-write timestamp, and ACL state.
- Network indicators — source IP addresses, CIDR ranges, and platform attributions associated with post-incident campaigns. Documented for blocklist and detection use. Explicitly labelled as not evidence of the original entry vector when applicable.
- Behavioural indicators — event patterns that are not single artefacts but sequences: purchase-order anomalies, logon timing clusters, process parent-child chains. Cross-walked to MITRE ATT&CK.
9. Key Findings
The technical core of the DFIR report. Findings are grouped by domain and given unique IDs:
| Domain | Prefix | Examples |
|—|—|—|
| System Profile | F-PROF | Unrotated admin password, unsigned binary running as admin, Defender not fully active |
| Authentication | F-AUTH | Brute-force logon records, Security log retention gap, Cloudflare WARP session analysis |
| Network | F-NET / F-NSG | RDP exposed to Internet, Azure NSG misconfiguration, firewall logging disabled |
| Persistence | F-PERS | Scheduled task XML modification, OneDrive task creation post-incident |
| File System | F-FS | Purchase-order fetch anomalies, batch DLL rewrite events |
| Application | F-APP | Credential exposure in app config, Defender never completed full scan |
| Azure Platform | F-AZ | Guest Agent version, VM image bake date |
| Validation | V-VAL | AmCache, BAM, SRUM, Shellbag, RecycleBin, and memory findings confirming or refuting hypotheses |
Each finding has a severity: Critical, High, Medium, Low, Informational, or Confirmed.
10. Immediate Recommended Actions
Prioritised remediation steps with the reasoning and responsible owner for each. High-priority actions address the attack surface directly. Medium actions address detection gaps. The reasoning column explains why each action is needed — not just what to do, but what attacker capability it closes.
11. Evidence Gaps
A table of everything the investigation could not determine, and why. Each gap is given an ID (EG-01, EG-02…) and explains what data source would be needed to close it. This section is essential for multi-party incidents where some evidence is held by another organisation, a cloud provider, or a third party.
12. Appendices — Raw Artefacts and Tool Inventory
- Appendix A — verbatim outputs of key artefacts: configuration file contents, scheduled task XML, surviving Security event-log samples, command transcripts, Defender state. All sensitive values redacted.
- Appendix B — full inventory of forensic tools used in the engagement (versions, hashes, collection targets).
Why DFIR Report Quality Matters
A DFIR report that simply lists “what we found” without methodology documentation, evidence sourcing, or confidence grading cannot be used in legal proceedings, insurance claims, or regulatory submissions. Simply Data DFIR reports are structured from the ground up to meet the evidentiary standards required by Malaysian regulators, legal counsel, and international insurers.
If your organisation has experienced a security incident — or wants to understand what a forensic investigation looks like before one happens — contact Simply Data for a consultation.
Frequently Asked Questions
How long does a DFIR investigation take?
Timeline depends on the scope and available evidence. An initial triage report can be delivered within 24–72 hours. A full DFIR report covering multiple hosts, cloud platform telemetry, and memory analysis typically takes 2–4 weeks from engagement to final report.
Can a Simply Data DFIR report be used as evidence in court or for regulatory submissions?
Yes. The report follows NIST SP 800-86 forensic methodology, every artefact is SHA-256 hashed before examination, and the chain of custody is documented throughout. The report structure and evidence standards are designed to meet the requirements of Malaysian courts, BNM RMiT, PDPA breach notification obligations, and cyber insurance claims.
What if the investigation cannot determine who attacked us?
Simply Data will state this explicitly. The Evidence Gaps section documents exactly what data source would be needed to establish attribution, what hypotheses remain open, and at what confidence level. An inconclusive root-cause finding is a defensible, honest outcome — not a failure of the investigation.
What is the difference between DFIR and a Compromise Assessment?
A Compromise Assessment is a proactive engagement — you run it when you want to check whether an attacker is present, without a known incident. DFIR is reactive — it is triggered by a detected incident and focuses on establishing what happened, when, and how. Many organisations run a Compromise Assessment annually and engage DFIR only when the assessment or another alert confirms a real incident.
—
Simply Data is NACSA-licensed and CREST-certified. Our DFIR analysts are trained to NIST SP 800-86 and SANS DFIR standards. Request a consultation to discuss your incident response readiness.
—
Lessons Learned from a Real Ransomware Investigation
The following lessons come directly from findings in a real Simply Data DFIR engagement — not general best practice guides. Names and identifying details have been removed.
What Organisations Get Wrong After a Ransomware Incident
Mistake 1: Rebooting the compromised host
This is the single most destructive action you can take. In the investigation above, the Windows Security event log was configured with a maximum size of 20 MB. On a high-activity host under a brute-force attack, this translated to approximately 22 hours of log retention. By the time Simply Data analysts were engaged, 15.2 million pre-detection Security event records had already been overwritten by the circular-buffer eviction. Pre-detection logon events for the actual incident date were irrecoverable.
Rebooting would have evicted the remaining post-incident logs too. Every log rotation event shortens the window of recoverable evidence.
Rule: Do not reboot. Do not restart services. Do not clear logs.
Mistake 2: Not capturing memory
RAM contains running processes, active network connections, in-memory credentials, and — in ransomware cases — potentially the encryption key itself. Once the host is rebooted or powered off, this evidence is gone forever.
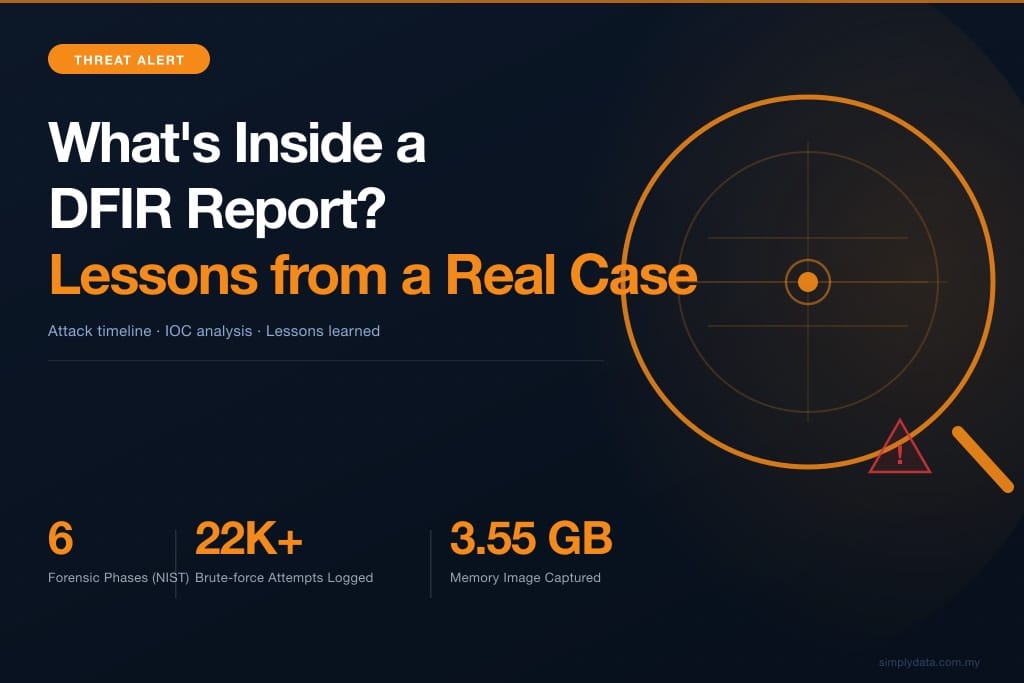
In this investigation, Simply Data deployed Velociraptor with WinPmem and captured a 3.55 GB compressed physical memory image. This image allowed analysts to examine the post-incident host state in detail, even 16 days after the detection event.
Rule: Capture memory with a forensic tool before any system intervention.
Mistake 3: Touching the affected host before calling DFIR
Every action on a compromised host after detection becomes part of the forensic record. File access timestamps change. New events are added to logs. Software installed for “cleaning” the system writes to artefact databases like AmCache and SRUM.
In this engagement, post-incident IT activity (log exports, file access, remote sessions) needed to be carefully separated from potential attacker activity using Shellbag enumeration, Velociraptor timeline analysis, and Edge browser history. This is possible — but it adds investigation time and complexity.
Rule: Isolate the host from the network. Then call DFIR before touching anything else.
Mistake 4: Assuming a clean antivirus result means no compromise
This host had Microsoft Defender real-time protection enabled — but a full anti-malware scan had never been performed. Defender for Endpoint (the Sense service providing EDR coverage) was stopped. Real-time on-access scanning only detects threats that actively touch the filesystem. An attacker operating entirely in memory using legitimate system tools (living-off-the-land) can operate undetected by antivirus.
Rule: Real-time antivirus is not a substitute for EDR and behavioural monitoring.
—
Pre-Incident Hardening That Would Have Changed the Investigation
These are real gaps found in this engagement — not hypothetical warnings.
| Gap found | What it cost | What to do |
|—|—|—|
| Windows Security log set to 20 MB (22-hour retention on active host) | Pre-attack logon evidence irrecoverable | Increase to minimum 500 MB; forward events to SIEM in real time |
| Windows Firewall logging disabled on all profiles | No record of inbound connections existed | Enable firewall logging: `Set-NetFirewallProfile -LogAllowed True -LogBlocked True` |
| RDP (TCP/3389) open to the Internet in Azure NSG | Host received 22,913 brute-force attempts from 256 external IPs post-incident | Restrict RDP to management subnet only or enable Azure Just-In-Time access |
| Plaintext credentials stored in world-readable config file | Credentials potentially exposed to any process running on the host for months | Move secrets to Azure Key Vault with Managed Identity |
| Admin password unchanged for ~10 months | Credential brute-force was viable throughout this period | Implement a password rotation policy; use individual accounts, not shared admin |
| Defender for Endpoint (Sense) not running | No EDR telemetry; no behavioural detection capability | Deploy and verify Defender for Endpoint on all production hosts |
| Microsoft Defender Tamper Protection disabled | Defender state could be changed without Event Log evidence | Enable via Intune or registry: `IsTamperProtected = True` |
These findings apply to thousands of Malaysian businesses running Azure infrastructure. The specific host in this investigation is not unusual — it represents a typical configuration gap profile for organisations that have grown quickly without a dedicated security operations function.
If you have Azure VMs with RDP or SSH reachable from the Internet, plaintext credentials in application config files, or Windows Security logs under 100 MB, your organisation has the same pre-conditions that made this investigation significantly harder than it needed to be.
A Compromise Assessment will surface these gaps before an incident. A Security Posture Assessment will map them against your full attack surface. Either is a significantly cheaper intervention than a DFIR engagement under incident conditions.