SD Monitoring is the data ingestion status layer of SD Unified Platform. Per-endpoint ingestion health across Trend Micro, Palo Alto, Fortinet, Elastic, Microsoft 365, Zoho, and any source via REST/syslog/webhook. Threshold-CSV alerting auto-opens tickets when ingestion drops. 100% data ingestion — no per-GB charges, no sampling, no blind spots.
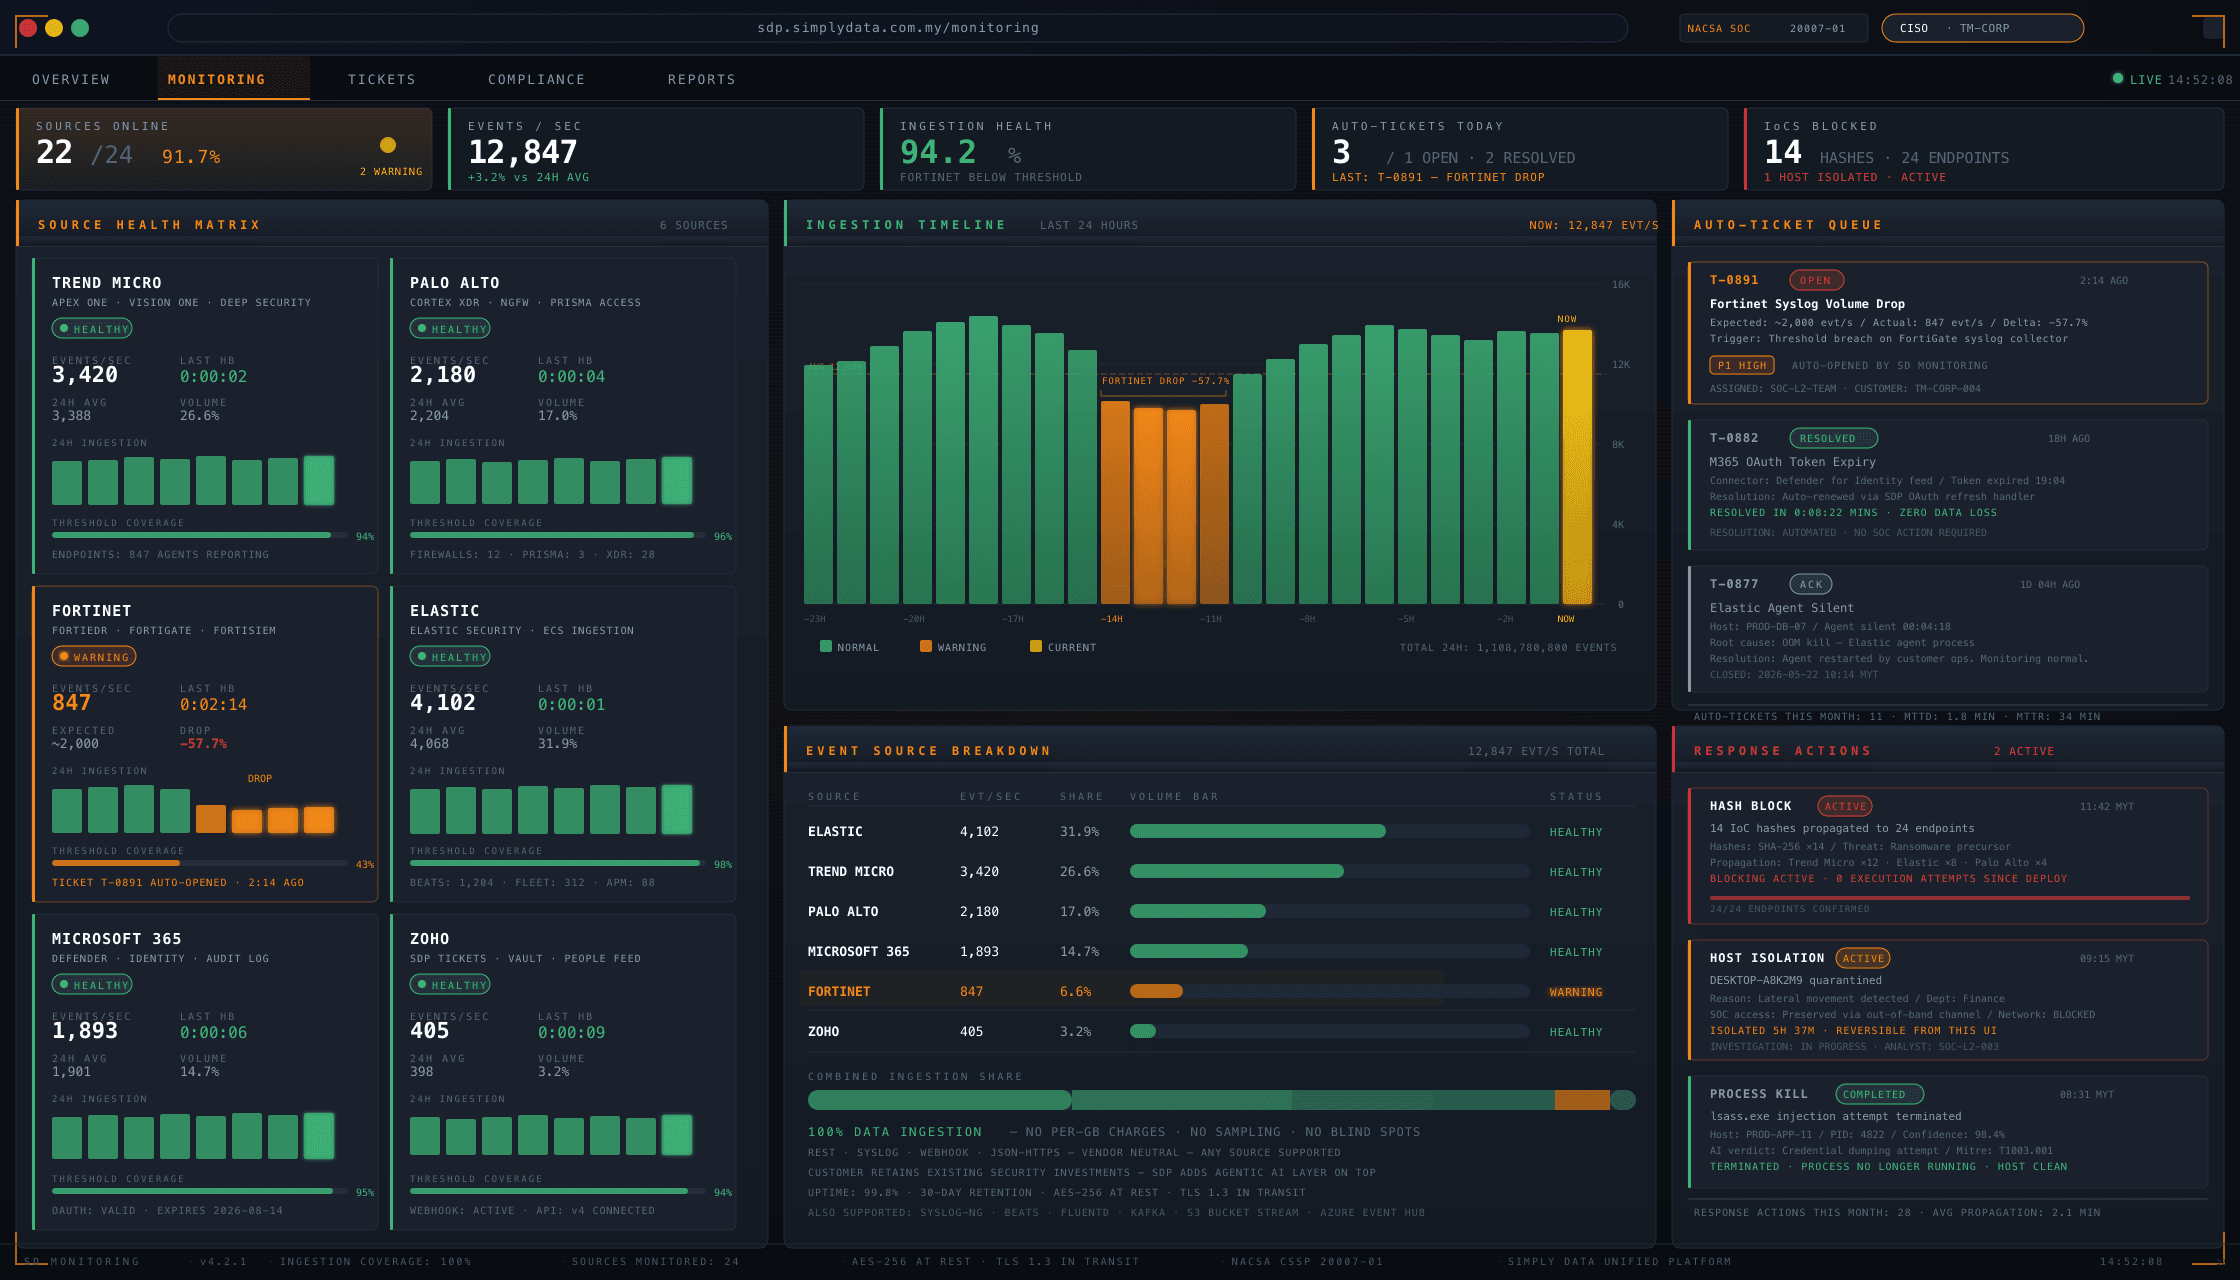
Data ingestion status across all customer endpoints
The most common cause of a missed alert is not a SIEM rule gap — it is a source that stopped reporting. The EDR (Endpoint Detection & Response) agent that crashed three days ago. The firewall syslog that pointed to a decommissioned collector. The Microsoft 365 connector that quietly expired its OAuth grant.
SD Monitoring is built to surface these failure modes before they become incidents.
Per-source visibility includes:
- Endpoint agent heartbeat. When was the last telemetry packet from this host? Is volume within expected bounds for the host’s normal pattern?
- Network source health. Is the firewall syslog landing? Is the IDS signal arriving? Is volume drifting?
- Identity source health. Is the directory connector pulling? Is the SSO (Single Sign-On) log feed live?
- SaaS source health. Microsoft 365 audit log, Zoho activity log, custom-API source health.
When a source degrades or drops, SD Monitoring opens a ticket against the SOC queue and surfaces the issue in SDP-Portal for the customer security lead.
Vendor-agnostic endpoint integration
SDP is engineered for heterogeneous Malaysian enterprise security stacks. SD Monitoring integrates natively with:
- Trend Micro — Apex One, Vision One, Deep Security
- Palo Alto — Cortex XDR, NGFW, Prisma Access
- Fortinet — FortiEDR, FortiGate, FortiSIEM
- Elastic — Elastic Security, ECS-formatted ingestion
- Microsoft 365 — Defender for Endpoint, Defender for Identity, audit log feeds
- Zoho — SDP ticketing, Zoho Vault, Zoho People (for HR-context correlation)
- And others via API — any source that exposes REST, syslog, webhook, or JSON-over-HTTPS
Vendor neutrality is the “no lock-in” promise in practice. Customers keep the security investments they have already made. Simply Data adds the agentic AI layer and the unified monitoring layer on top.
This is a deliberate architectural choice. Other Malaysian MSSPs resell a single SIEM (Splunk, Sentinel, XSIAM) and force customers into the vendor stack. SDP takes the opposite approach — customers bring their existing telemetry sources, SDP unifies and acts on them.
Hash blocking + isolation
SD Monitoring is not just an observability layer — it is also a response layer. From the same UI, operators can push response actions back into the endpoint estate.
- Hash blocking (IoC — Indicator of Compromise — management). Push a malicious file hash to every endpoint agent in the customer estate. The block propagates within minutes; subsequent execution attempts on any host fail.
- Host isolation. Quarantine a compromised host from the network while preserving SOC team access for investigation. Reversible from the same UI.
- Process kill. Where the EDR vendor exposes the capability, terminate a specific running process across the estate.
- Scan trigger. Force a full or signature-only scan on a specific host or host group.
Response actions are RBAC (role-based access control)-controlled and captured to the audit trail with operator identity, timestamp, justification, and outcome. For regulated customers, this audit trail satisfies “who took what action, when, why” obligations under BNM RMiT and PDPA.
Threshold-CSV alerting pipeline
The threshold-CSV alerting pipeline is one of SDP load-bearing automation patterns. It is the answer to “alert me when X drops below Y” at scale.
The pipeline works as follows:
- Threshold definition. Each tenant defines threshold tables — ingestion volume floors per source, time-since-last-heartbeat ceilings per endpoint, alert-volume anomaly bounds.
- Continuous evaluation. SDP evaluates thresholds against live telemetry on a per-tenant scheduler.
- CSV generation. When a threshold breach is detected, SDP generates a CSV evidence file with the breach detail (source, time, volume, baseline).
- Ticket attachment. The CSV is automatically attached to a SOC ticket in Zoho SDP, with full breach context.
- AI investigation. The agentic AI triage layer picks up the ticket, correlates against prior breach patterns, classifies severity, and either closes (false positive — known noise window) or escalates.
- Customer notification. Where appropriate, the customer security lead is notified via Microsoft Teams or email, with a link to the SDP-Portal ticket view.
This is the productivity unlock for ingestion health monitoring at scale. No human writes “EDR on host X stopped reporting at 02:14” — the pipeline writes it, attaches the evidence, and routes it to the right place.
Compliance auto-evidence collection
SD Monitoring feeds directly into the SDP compliance evidence pipeline. Ingestion logs, threshold-CSV breaches, response action records, and operator audit trails are all rolled up into framework-keyed evidence packs.
Frameworks served:
- PCI-DSS v4.0.1 — Requirement 10 (log and monitor) evidence
- BNM RMiT — Section 11.x technology resilience evidence
- ISO 27001:2022 — A.8 asset management + A.12 operations security evidence
- NIST CSF 2.0 — DE.CM (Detection: Continuous Monitoring) evidence
- PDPA — Section 12B data security evidence
- CSA 854 — Cyber Security Act 2024 obligations
Evidence packs are downloadable from SDP-Portal on demand by authorised compliance officers — no help-desk ticket, no scheduled report waiting, no audit-week scramble.
Read more: SDP-Portal compliance access
SD Monitoring vs commodity ingestion monitoring
Several SIEM and SOAR (Security Orchestration, Automation & Response) vendors offer “ingestion health” tiles in their consoles. SD Monitoring is engineered for a different bar.
| Capability | Commodity ingestion monitoring | SD Monitoring |
|---|---|---|
| Per-source heartbeat | Yes | Yes |
| Threshold-based alerting | Threshold settings buried in admin UI | Threshold-CSV pipeline with auto-ticket + auto-evidence |
| Response action integration | Separate console | Same UI: hash block, isolate, kill, scan |
| Compliance evidence rollup | Manual export | Auto-rollup into PCI-DSS, BNM RMiT, ISO 27001, NIST CSF, PDPA, CSA 854 packs |
| Vendor lock-in | Locked to the SIEM/EDR vendor | Vendor-agnostic — bring your existing stack |
| Audit trail | Console-side log retention | Same AI audit chain as the rest of SDP |
| Customer-facing surface | Operator-only | Customer-visible via SDP-Portal |
The integration with the agentic AI layer is the multiplier. When a threshold breaches, SDP does not just light a console tile — it opens a ticket, attaches the evidence, runs AI triage, and surfaces the outcome to the customer via SDP-Portal. End-to-end.
Operator audit trail for response actions
Every response action — hash block, host isolation, process kill, scan trigger — is captured to a structured audit trail.
Per-action audit fields:
- Operator identity (Simply Data SOC engineer or customer-authorised actor)
- Action type and target (host, hash, process, scope)
- Justification (free-text reason + linked ticket reference)
- Timestamp (UTC + MYT)
- Pre-action state snapshot
- Post-action state snapshot
- Reversal handle (where the action is reversible)
This audit trail is the answer to the regulator question: “who took what action on whose endpoint, when, and why?” For BNM-regulated FIs and PDPA data controllers, this is not optional — it is the difference between a clean audit and an inspection finding.
The audit trail is exposed in SDP-Portal to authorised customer compliance officers, and feeds the compliance evidence pipeline automatically.
SD Monitoring deployment patterns
SD Monitoring supports three deployment patterns matched to customer requirements:
Pattern 1 — Full Simply Data managed. Simply Data SOC team operates SD Monitoring end-to-end. Customers see the visibility surface via SDP-Portal. Typical for BNM-regulated FIs, government agencies, and large enterprises without an internal SOC.
Pattern 2 — Co-managed. Simply Data SOC team operates the platform; customer security team operates response actions for their own estate via SDP-Portal (with appropriate role grants). Typical for large enterprises with a mature internal security function.
Pattern 3 — Customer-managed with Simply Data backstop. Customer security team operates SD Monitoring directly; Simply Data SOC team provides escalation backstop and after-hours coverage. Typical for organisations with mature 24/7 internal SOCs seeking compliance-grade audit chain.
All three patterns retain the per-tenant audit trail and the compliance evidence pipeline.
Why Customers Choose Simply Data SD Monitoring
Six outcomes that matter to procurement, compliance, and operations teams.
No Per-GB Surprise Invoices
Commercial model is per-endpoint, not per-byte. Customers ingest as much as they need without watching a counter.
Blind-Spot-Free Operations
Per-endpoint heartbeat tracking surfaces silent drops before they become incidents. No more “we noticed the agent stopped reporting two weeks ago.”
SLA-Grade Ingestion Evidence
Per-tenant ingestion health surfaces in SDP-Portal as a customer-facing SLA metric — not just internal ops dashboards.
Auto-Ticket on Threshold Breach
Threshold breached → ticket opened → CSV evidence attached, before a human notices. Coverage becomes a guarantee, not a hope.
Sovereign Storage With Audit Chain
Ingestion data stored on Malaysian-resident infrastructure. TLSv1.3-pinned, AES-256-GCM at rest, signed audit chain for regulators.
Compliance Evidence Without Analyst Tickets
Ingestion logs roll into PCI-DSS, BNM RMiT, ISO 27001, NIST CSF, PDPA, and CSA 854 packs automatically.
Frequently Asked Questions
What is SD Monitoring?▾
SD Monitoring is the data ingestion status layer of SD Unified Platform.
What sources does SD Monitoring cover?▾
Trend Micro, Palo Alto, Fortinet, Elastic, Microsoft 365, Zoho, and any source via REST, syslog, or webhook.
Are there per-GB charges?▾
No. SD Monitoring is engineered for 100% data ingestion with no per-GB fees.
What happens when ingestion drops?▾
SDP auto-opens a ticket and attaches the threshold-CSV evidence.
How does SD Monitoring help with compliance?▾
Ingestion logs roll up automatically into PCI-DSS, BNM RMiT, ISO 27001, NIST CSF, PDPA, and CSA 854 evidence packs.
Where is the ingestion data stored?▾
All ingestion data is stored on Malaysian-resident infrastructure. TLSv1.3-pinned, AES-256-GCM at rest.
Can I see ingestion health as a customer?▾
Yes. SD Monitoring metrics surface in SDP-Portal as live per-endpoint heartbeat status.
What thresholds does SD Monitoring use?▾
Per-source thresholds for log volume (±20% baseline by default), heartbeat gap (60s by default), and ingestion rate.
Other SDP Modules
Explore the rest of SD Unified Platform.
Get Your Free Consultation Now!
We’re here to help! Contact us to learn more about SD Monitoring and SD Unified Platform.
Talk to a Simply Data engineer
Pre-launch briefings include a live walk-through of SD Monitoring on a sanitised demo tenant. Engineers — not sales reps — answer technical questions.
Reserve a Demo Briefing →Or reach us directly: